Performance Benchmarking: How to Set and Read Benchmarks
Learn what performance benchmarking is, which metrics to compare and how social and marketing teams can run fair, useful benchmarks.

You're preparing the monthly social report. One post looks strong, another looks disappointing, and someone wants to know whether changing the posting schedule helped. You have plenty of numbers, but you're not sure which comparisons would justify a decision.
Performance benchmarking starts with making those comparisons fair. Before ranking posts, accounts or scheduling tools, you need to establish what each number measures, who it represents and what would count as a meaningful improvement.
Table of Contents
- What Performance Benchmarking Means and Why Averages Mislead
- Types of Benchmarking and the Question Each One Answers
- Metrics Worth Benchmarking and How to Calculate Them
- Comparing Like With Like Across Platforms and Audiences
- How to Run a Benchmark Step by Step
- Benchmarking in Practice for Social and Marketing Teams
- Pitfalls and Best Practices That Keep Benchmarks Honest
- Choosing Tools and Starting Your First Baseline
What Performance Benchmarking Means and Why Averages Mislead
Say a social media manager presents a post's 4.2% engagement rate as a win. A colleague points out that the account averages 6%, and that this was the only giveaway post that month. These are hypothetical figures, but the disagreement is familiar: nobody has agreed what a fair comparison looks like.
The result could be weak against the account average yet strong against comparable giveaway posts. It could also use a different engagement denominator from the report everyone else is reading. The percentage alone can't settle the argument.
A number needs a reference point
Performance benchmarking means measuring a result against a relevant reference point. A runner's finishing time means more when compared with their previous race under similar conditions than with an unrelated athlete's record.
Every useful benchmark has three parts:
- A metric: The result you're measuring, such as saves per account reached.
- A comparison basis: The past posts, similar accounts or agreed target you're comparing it with.
- A consistent method: The definitions and conditions that make the comparison fair.
Without those parts, a benchmark is just a number beside another number.
Why the average can describe very little
A viral post or giveaway can lift the monthly mean while most ordinary posts remain below it. Using that mean as the expected result for every post makes routine performance look disappointing.
The median, the middle result after sorting posts by performance, is less sensitive to an exceptional post. Pair it with the middle range, such as the range between the lower and upper quartiles, to show how much ordinary results fluctuate.
Practical rule: Compare a post with the kind of post it actually is, not simply with everything published that month.
Keep exceptional posts in the record, but label them. A giveaway may deserve its own comparison group rather than becoming the standard for educational carousels. A benchmark is only as good as the comparison behind it.
Types of Benchmarking and the Question Each One Answers
A historical benchmark asks whether you're improving. A peer benchmark asks where you stand among similar accounts. A target benchmark asks whether the plan worked.
These aren't interchangeable questions. An account can improve against its own history, remain behind comparable brands and still meet its agreed target. All those conclusions can be true.
Choose the comparison for the decision
Benchmark types, the question each answers and its main risk
| Type | Compares against | Question it answers | Main risk |
|---|---|---|---|
| Internal (historical) | Your own past results on the same account | Are we improving over time? | Old baseline may predate platform or audience changes |
| Peer | Accounts of similar size and sector | How do we compare with similar brands? | Peer data is hard to source and account sizes differ |
| Competitor | Named rivals' public metrics | Where are we losing attention? | Only public signals; no reach or spend data |
| Industry or external standard | Published sector or national figures | Is this normal for our sector? | Averages hide spread and definitions vary |
| Target (goal-based) | A pre-set goal, such as a save rate | Did we hit what we planned? | Targets set without a baseline are guesses |
| Process | Internal workflow times against a set standard | How long does approval take? | Needs timestamps; manual logs are unreliable |
Peer and competitor benchmarking need particular care. A direct commercial rival may have a much larger audience or a different distribution strategy. A less obvious business with a similar audience size, content mix and objective could provide a fairer operational comparison.
Public competitor metrics also have limits. You can observe reactions and comments, but you usually can't calculate a comparable reach-based rate without access to the underlying account analytics.
Combine context with ambition
Think of a bathroom scale, a height chart and a goal weight. The scale shows today's measurement, the chart supplies context for your size, and the goal describes what you're aiming for. None replaces the others, and a population comparison isn't a personal prescription.
Marketing teams similarly benefit from combining benchmark types. For example, a hypothetical team might set a target from its own six-month history, then check whether that target sits within a credible peer range.
A process benchmark serves a different purpose again. If approvals take too long, the useful comparison is against an agreed turnaround standard, not another brand's engagement rate. Choose the comparison before collecting the numbers, otherwise you risk choosing whichever reference makes the result look strongest.
Metrics Worth Benchmarking and How to Calculate Them
Start with the objective. An awareness campaign should lead with reach, a traffic campaign with click-through rate, and a lead campaign with conversion rate alongside lead quality.
Using several indicators is sensible when they answer distinct questions: the Office of Rail and Road's benchmarking approach compares National Highways across six regions and with comparable organisations using a broader suite of performance and efficiency measures. For social teams, the useful principle is to separate operating conditions from execution before ranking results.
Define the calculation before using the label
Core social and marketing metrics, formulas and cautions
| Metric | How to calculate | What it tells you | Watch out for |
|---|---|---|---|
| Reach | Unique accounts that saw a post | Audience size | Platforms define unique viewers differently |
| Engagement rate by reach | (Likes + comments + shares + saves) ÷ reach × 100 | Response quality per viewer | Follower-based rates are not comparable |
| Save rate | Saves ÷ reach × 100 | Usefulness of content | Favours practical, informational formats |
| Click-through rate | Link clicks ÷ impressions × 100 | Action taken after viewing | Organic and paid results must be separated |
| Conversion rate | Conversions ÷ clicks × 100 | Commercial outcome | Depends on the attribution window used |
| Publishing success rate | Posts published as scheduled ÷ posts scheduled × 100 | Execution reliability | Failed posts disappear inside averages |
| Approval cycle time | Median hours from submission to approval | Workflow speed | Use the median; one slow approval skews the mean |
| Net follower growth | (New followers − unfollows) ÷ starting followers × 100 | Audience growth | Bought or incentivised followers distort it |
The denominator is the quantity beneath the division line. Engagement divided by followers measures response relative to the account's potential audience; engagement divided by reach measures response relative to accounts actually exposed. Those rates answer different questions.
Write the denominator into the metric name. Also define what counts as an engagement or conversion, and treat an unavailable metric as missing rather than zero.
Separate audience response from execution
Context metrics, including reach, saves and clicks, reflect audience selection, creative content and distribution. Execution metrics, including publishing success and approval duration, test whether the team's workflow functions as intended. A missed publish isn't an underperforming piece of content.
For workflow and tool evaluations, also record scheduling task duration, required-network coverage, analytics refresh delays and cost per managed account. Test equivalent tasks using the same account permissions and content conditions, and retain failures and unusually long delays rather than smoothing them away.
Give each metric a named owner and keep the objective's working scorecard to no more than five metrics. The guide to KPI measurement helps organise that selection; when you need to connect content activity with financial outcomes, TheContentMap's explanation of how to measure content ROI provides useful measurement context.
Comparing Like With Like Across Platforms and Audiences
A platform-wide audience figure and an account's post reach answer different questions. Ofcom's 2025 figures, summarised by ProfileTree's platform-use overview, report YouTube reaching 94% of UK online adults, with 51 minutes of average daily use. Facebook and Messenger together reach 93%, with 43 minutes of daily use, while Instagram reaches 78%, with 20 minutes of daily use.
UK platform reach and daily use benchmarks, 2025
| Platform | UK reach | Average daily use | Benchmarking note |
|---|---|---|---|
| YouTube | 94% of UK online adults | 51 minutes | Compare watch time and completion, not likes alone |
| Facebook and Messenger | 93% of UK online adults, combined | 43 minutes | Keep the combined service grouping visible |
| 78% of UK online adults | 20 minutes | Compare against its own baseline |
These figures describe platform use, not the reach an individual account should expect. The Facebook figure combines Messenger and Facebook, while Instagram is reported separately. Keep those scopes visible; comparing the grouped figure with a standalone service without noting the difference can mislead.
Audience composition changes the comparison
Ofcom's 2025 UK media-use findings report Instagram use among 63% of women and 56% of men, while YouTube use was 87% among men and 77% among women. These percentages describe platform use, not engagement.
If a posting test reaches a different audience mix, its results may change even when the creative and cadence stay the same. Check who received the posts before attributing a difference to timing.
Attach context to every result
Record the comparison conditions alongside each performance metric:
- Audience composition: Geography, age and other relevant characteristics where available.
- Account size: Use a consistent follower band rather than a broad label such as “small brand.”
- Content type: Separate tutorials, product demonstrations, announcements and promotions.
- Distribution: Mark paid, organic and boosted content distinctly.
- Measurement scope: Identify post-level reach, account-level reach and the reporting window.
Use the guide to how reach is measured to reconcile exports. Adding post-level reach figures does not produce unique campaign reach, because the same account may have seen multiple posts.
How to Run a Benchmark Step by Step
A useful benchmark ends in a decision, not merely a chart. The following procedure keeps the decision, measurement and comparison connected.
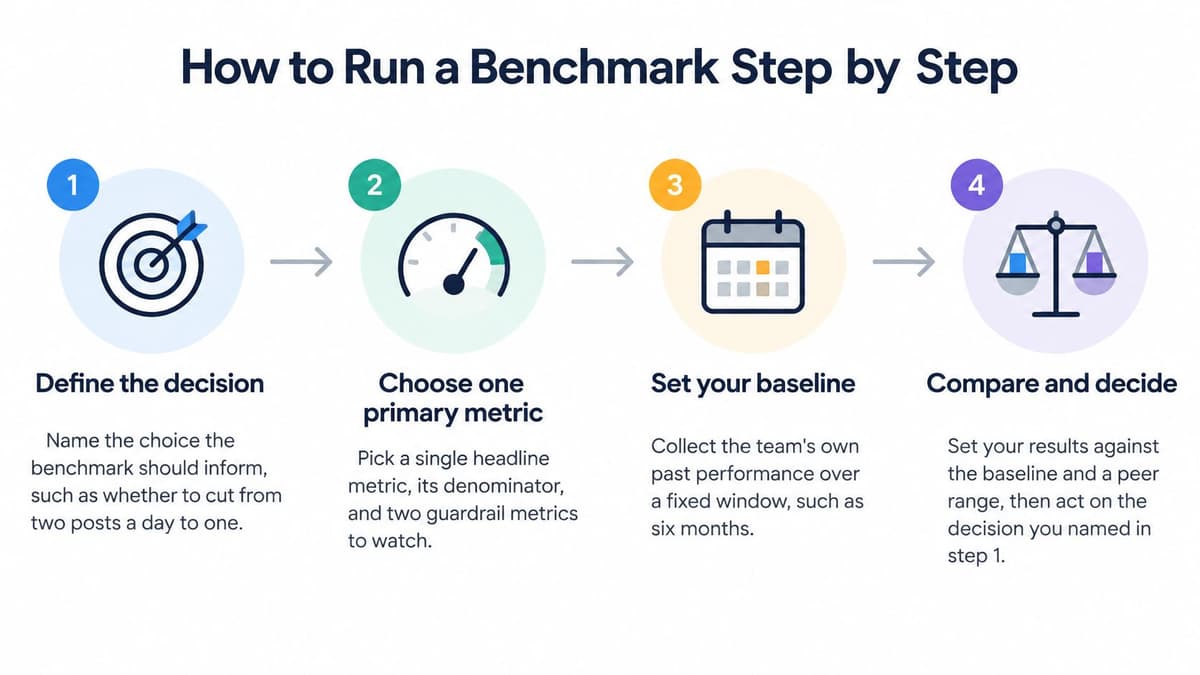
This overview shows the main stages from defining the choice to interpreting the result.
Establish the test before changing anything
Define the decision. In a hypothetical cadence test, you might ask whether to cut from two posts a day to one. Write down what evidence would justify that change, including any outcome you're unwilling to sacrifice.
Choose the primary metric and guardrails. Select one headline metric, specify its denominator and add two supporting measures. For a useful-content objective, save rate could lead, while total reach and qualified website visits act as guardrails against improving the rate by reaching fewer people.
Select the comparison set. A practical starting design might use the account's previous six to twelve weeks, one or two genuinely comparable peer accounts and an agreed target. Only include peer metrics whose definitions you can verify; an unavailable comparison is better than a misleading one.
Fix the window and conditions. For example, plan a 28-day test with comparable content categories and posting-time bands. Record the intended mix before publication, so a last-minute promotion doesn't skew the experiment without anyone noticing.
Collect the baseline and sample size. Store post identifiers, publication dates, formats, distribution status, metric values and extraction dates. Label the number of posts and relevant exposure, so a hypothetical sample of nine posts isn't treated as equally informative as ninety.
Calculate the median and spread. Sort comparable post results, identify their middle range and flag observations outside it for investigation. For a rate-based objective, distinguish the typical post's rate from the aggregate rate calculated using total actions divided by total exposure.
Interpret and schedule the review. Answer the original decision, record contextual events such as a holiday or platform outage, and choose the next review date. If the evidence is inconclusive, state what additional observations you need rather than declaring a winner.
Read the result without overstating it
Consider a hypothetical worked example: an account's median save rate over eight weeks is 1.8%, its comparable peer range is 1.2% to 2.6%, and its pre-set target is 2%. The account is within the peer range but below its target, so this isn't a clear win.
That interpretation is more useful than calling the result good or bad. The team can investigate which formats generated useful saves, check whether the sample covers normal trading conditions, and decide whether the target remains reasonable.
A result inside a normal range isn't evidence that nothing happened. It means you need stronger evidence before claiming an improvement.
When comparing successive windows, change one planned variable where possible. If you alter cadence, creative format and paid support together, you can assess the combined approach, but you can't confidently credit any individual change.
Benchmarking in Practice for Social and Marketing Teams
Teams can use the same benchmarking principles while making quite different decisions. An agency needs to identify accounts requiring attention; a launch team needs to judge a campaign; a creator needs a relevant standard.
The illustration brings together the reporting, strategy and outcome checks involved.

An agency's monthly client review
Suppose an agency compares each client with its own six-month baseline and a peer range for similarly sized accounts. It flags accounts outside their expected range and checks publishing success separately.
If an account loses reach while all planned posts publish correctly, the team investigates distribution and creative choices. If posts fail to publish, it fixes that operational problem before judging the content strategy.
A product launch
A launch team sets its target before publication and tracks paid and organic click-through and conversion rates separately. It compares results with both the target and the pre-launch baseline, then checks whether visitors became qualified leads.
A scenario in which clicks meet the target but qualified leads don't calls for landing-page or audience investigation, not an automatic increase in posting. Software businesses can use the framework for measuring social media ROI for SaaS teams to connect reporting with downstream outcomes.
For an accompanying overview of benchmarking, watch the video below.
A small business asking what good looks like
A local business needs benchmarks for its own formats, audience and objective, not a creator's most successful campaign. LOCALiQ's UK paid-campaign analysis, described in the CORQ Data Review, found year-on-year click-through rates increased 5.6% and conversion rates rose 10.6% across 2023 to 2024.
That indicates movement in paid-campaign performance, not proof that organic scheduling caused an improvement. A lower engagement rate can still be the better result when content reaches a larger or more commercially relevant audience.
Segment selection matters too: Ofcom's 2025 news-consumption findings show that among 16- to 24-year-olds using social media for news, TikTok reached 31%, YouTube 30%, Instagram 24% and Facebook 21%. Those figures describe news use within that group, so they support segment-specific planning, not universal platform rankings.
Pitfalls and Best Practices That Keep Benchmarks Honest
A campaign can receive credit for a purchase without creating it. A customer may click a scheduled post after already deciding to buy, so attributed conversions alone cannot show whether the campaign generated additional demand.
Incrementality asks what happened because of the activity that would not otherwise have happened. Comscore's 2025 UK social research examines incrementality, audience overlap and performance benchmarks across brands, media and influencers.
Look for additional demand, not just assigned credit
Where practical, compare an exposed group with a similar holdout group that does not receive the campaign. Set the allocation and success measure before launch, and check that other marketing activity does not differ systematically between groups. If the groups are small or unlike each other, the comparison may be too noisy to support a firm conclusion.
Small businesses may not have enough observations for a precise experiment. Supporting signals can still help explain what happened:
- Branded-search trends: Check whether interest changes, while noting other campaigns that could explain it.
- Unique landing-page visits: Use consistent campaign tags and inspect visitor quality, not just totals.
- Assisted conversions: Record content's supporting role without assuming every touchpoint caused the sale.
- Lead quality: Track whether enquiries meet the business's qualification criteria.
- Cost per incremental action: Divide relevant campaign costs by additional actions estimated against a credible comparison.
Agreement among these signals is not causal proof. Attribution windows, privacy restrictions and gaps in cross-platform identity limit what you can observe.
Evidence standard: State whether a conclusion comes from an experiment, an observational comparison or a platform attribution report.
Make the process auditable
Record the benchmark definition, inclusion rules, extraction method and owner. Keep metric definitions stable where possible. If a platform change forces a new definition, version it and mark the break so readers do not mistake a measurement change for a performance trend.
Maintain an audit log of platform changes, tracking interruptions and campaign exceptions. Review results on a fixed cadence, and state how much confidence the evidence supports. Use statistical intervals when the method allows them; otherwise, label the evidence strength clearly.
Report incrementality evidence alongside platform results. A campaign may receive credit for conversions while its additional contribution remains uncertain.
Choosing Tools and Starting Your First Baseline
Start with native platform analytics. Available reach, engagement and follower figures can support an initial internal baseline without adding another reporting system.
When the missing information concerns cross-channel reporting, publishing logs or approval timestamps, consider tools such as Metricool, Sprout Social, Hootsuite, Buffer and Later. They differ in reporting emphasis, publishing workflow and collaboration support, while analytics depth and access can vary by plan.
Test the gap you actually need to fill
Ask each shortlisted tool to demonstrate the export or workflow you need. Check whether it preserves your metric definitions, distinguishes paid from organic activity and retains enough history for your comparison window.
A simpler workflow may suit a solo creator, while an agency may need more detailed permissions and client reporting. Check each vendor's own site for current pricing, supported networks and plan limits, since these can change.
Use side-by-side scheduler comparisons, browse the scheduler directory, check Instagram scheduler options for network fit, or review analytics-focused options.
Build the first baseline
- Export recent history. Start with the last eight weeks of available metrics.
- Create the baseline table. Use the metric definitions above and retain the context fields.
- Choose the primary benchmark type. Match it to the decision you need to make.
- Book the review. Set a date four weeks ahead and assign responsibility for the update.
Scheduler.social is an independent directory and review site, not a scheduling tool, that helps you compare social media schedulers. Visit Scheduler.social to compare reporting capabilities, workflow trade-offs and platform coverage, and find the right scheduler for your benchmarking needs.