KPI Measurement for Social Marketing Teams
KPI measurement for social teams: choose metrics by goal, write auditable formulas, map data to revenue, and test whether activity created real demand.
Your Monday report is green, your posting volume is up, and nobody can answer the only question that matters. Did demand move? If your team is celebrating engagement while sales are asking what changed, your problem isn't effort. It's KPI measurement that blends activity, quality and outcomes into one flattering number, then treats every platform as if it's the same audience doing the same thing.
Table of Contents
- Why Social KPI Measurement Goes Wrong
- Choosing KPIs That Match the Goal
- Writing KPI Formulas Teams Can Audit
- Mapping Data from Post to Revenue
- Testing Incrementality Without a Lab
- Running Cadence Governance and Pitfalls
- Picking a Scheduler That Supports Measurement
Why Social KPI Measurement Goes Wrong
A social stand-up can show a blended engagement rate rising across Facebook, Instagram, TikTok and YouTube while enquiries stay flat. Sales asks what changed, the website team questions traffic quality, and nobody can connect a successful post to a later customer action. The problem is a broken measurement chain: the goal, formula, data source and evidence of incremental impact do not line up.
Start by separating what each measure can prove. Publishing consistency records whether planned activity happened. Reach and impressions show exposure. Engagement records reactions within a platform. Clicks, qualified visits and conversions bring measurement closer to business value, but attribution alone does not prove a post caused the outcome. Combining these stages in one score conceals where the chain fails.
Platforms Are Not Interchangeable Audiences
A shared target across platforms can hide meaningful differences in audience and behaviour. Ofcom's 2025 News Consumption Survey found 51% of UK adults use social media to access news. That overall figure is not a benchmark for a brand, and it does not make a Facebook link post comparable with a TikTok video or YouTube upload.
The survey also shows why results need platform and audience context. Facebook reached 30% of UK adults for news and remained the most-used social media news service; TikTok reached 11%, up from 1% in 2020. Three-quarters of UK adults aged 16 to 24 use social media for news. These figures describe news use, not your customers, so do not transplant them into brand targets.
Set separate baselines for each network and audience. Compare like with like: the same format, a defined audience and a consistent denominator. A video completion rate and a link click rate answer different questions. Keep those measures distinct, then provide a roll-up only as context. The combined figure is a summary, not proof of business impact.
Fast platform dashboards can help teams react to delivery, but their attributed conversions may not reconcile with sales or website records. Use a slower, reconciled number when the decision depends on confirmed outcomes. Name the goal, write the formula, specify the data source and check whether the result reflects incremental change, not just activity receiving credit. If any link in that chain is unclear, the KPI cannot support a confident decision.
Choosing KPIs That Match the Goal
Pick fewer KPIs and make each one earn its place. Start with the business goal, choose one primary outcome KPI, add one or two operational indicators that explain movement, and park everything else as diagnostic data you consult only when something breaks.
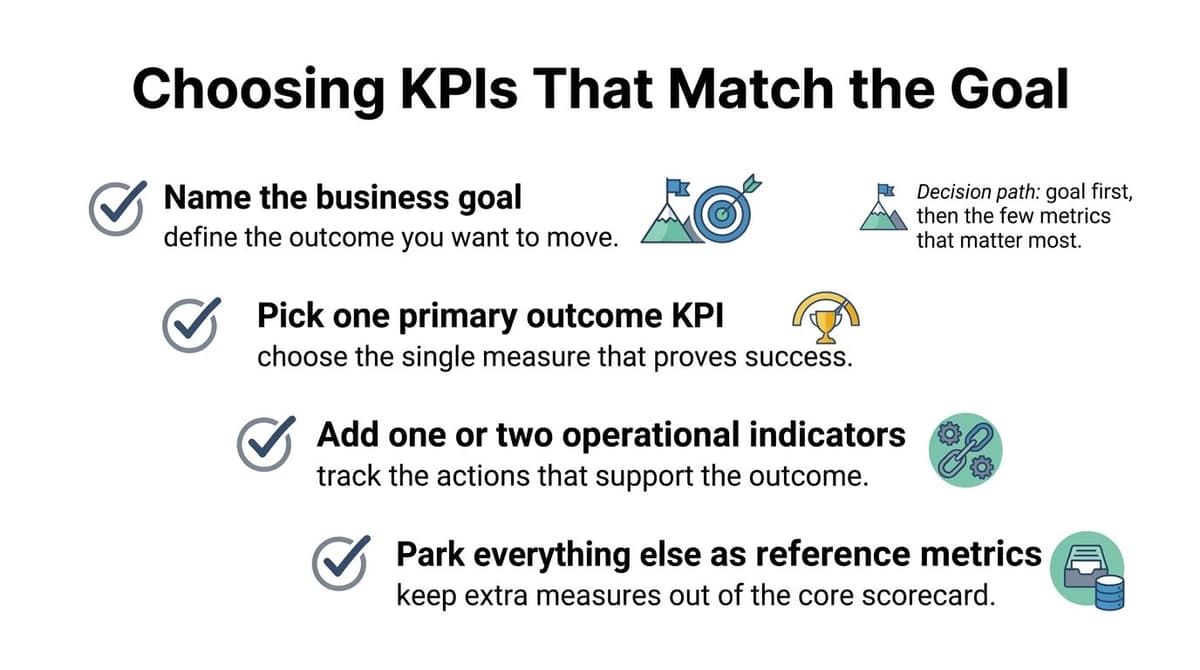
Work through that decision path for each goal your team owns:
- Awareness: Use qualified reach within a defined audience as the outcome. Support it with impressions per post and video completion where format matters.
- Traffic: Use sessions that meet a quality rule you define, not raw link clicks alone. Support it with click-through rate by platform and landing page.
- Lead quality: Use leads accepted by sales, or demo requests that meet your criteria. Support it with conversion rate from social session to enquiry.
- Publishing consistency: Use planned posts published on time as an operational KPI. Don't present it as impact, because it's an input you control.
- Retention: Use repeat visits, repeat purchases or renewal behaviour from customers exposed to your content. Support it with saves, shares or replies only as early signals.
Write the Selection Template Before the Dashboard
For every KPI you keep, write five lines in plain language. Name the goal, the audience, the decision this KPI will change, the owner, and the action you'll take if it moves the wrong way. If you can't fill in the decision and action, it's not a KPI yet. It's a metric looking for a job.
That discipline also stops a common confusion. Using KPIs isn't the same as adopting a balanced scorecard. A Cranfield School of Management and Watson Wyatt study of 159 respondents found 60% of larger companies used KPIs to a great extent and 90% used them to at least some extent, while balanced scorecards were used to a great extent by 18% and to at least some extent by 55%. In other words, tracking publishing consistency, engagement rate, click-through rate or conversion rate doesn't automatically give you a strategy system. It's a set of indicators until you link them to objectives and decisions.
If a KPI won't change a budget, a format, a channel or a publishing decision, demote it to diagnostics and stop reporting it as performance.
Don't lift a competitor's dashboard wholesale either. Their audience mix, offer and sales cycle aren't yours, so their primary KPI may answer a question you don't have. If you want a practical view of how operational measures sit alongside outcome measures, social operations metrics with Sift AI is a useful companion for separating day-to-day social activity from business results. Take the structure, then choose the short set that matches your goal and bring that into planning.
Writing KPI Formulas Teams Can Audit
A social stand-up can end with a polished engagement chart and no answer to the sales team's question: what changed? Make each KPI traceable from the business goal to its formula, reporting source and test of incremental impact. Start by defining metric name, numerator, denominator, time window and source. If two analysts can pull the same report and get different results, the definition is not ready to report.
Engagement rate shows why the denominator matters. Dividing interactions by followers measures response against the existing audience; dividing by reach measures response among people who saw the post; dividing by impressions includes repeat views. Choose one primary formula for each report, label it in the chart title, and use this guide to calculate engagement rate consistently. Keep other versions as diagnostics, not competing headline KPIs.
What a Real UK Report Shows About Denominators
Highland Council's social analytics offer a useful example of why a percentage needs context. For April to June 2025/26, the council recorded 613.4K users reached, 7.6M content views and 50.7K followers, with an overall average return on engagement of 6.84%. Channel rates varied, so treat the headline as a result for that report, not a target to copy.
Use one source link, then record the formula, denominator and period beside every channel figure. Without those details, a percentage cannot support a fair comparison. A slower figure reconciled across reporting sources may be more useful than a fast platform-attributed result, especially when the latter uses a different attribution window. Speed is not evidence of accuracy.
Social KPI formulas to write before you report
| KPI | Numerator | Denominator | Do not confuse with |
|---|---|---|---|
| Reach | Unique accounts or users who saw content | Not a rate, report as a count for the period | Impressions, which count repeat views |
| Engagement rate | Likes, comments, shares, saves and other defined interactions | Reach, impressions or followers, named explicitly | A blended score using different bases per channel |
| Click-through rate | Link clicks | Impressions or reach, named explicitly | Website sessions, which may be lower after load or consent loss |
| Video completion rate | Views reaching your defined completion point | Views that started the video | Views alone, which do not show sustained attention |
| Conversion rate | Completed enquiries, sign-ups or purchases | Social sessions, link clicks or landing page views, named explicitly | Platform-attributed conversions using a different window |
Keep awareness and action distinct in the formula and the report. A view is exposure, a click is a response, and a completed enquiry or purchase is an outcome. They answer different questions, so do not combine them into a single score or present one as proof of another.
For every result, state who was measured, what the KPI counts, which denominator and source were used, and the reporting period being compared. If the team cannot reproduce the figure from those details, hold it out of the performance summary until the definition and data agree.
Mapping Data from Post to Revenue
Your formulas can be perfect and your reporting can still fail at the joins. Social data lives in a scheduler or native analytics, traffic sits in web analytics, leads sit in a CRM, and revenue sits in commerce or finance. KPI measurement becomes credible when you map that chain and label how much you trust each link.
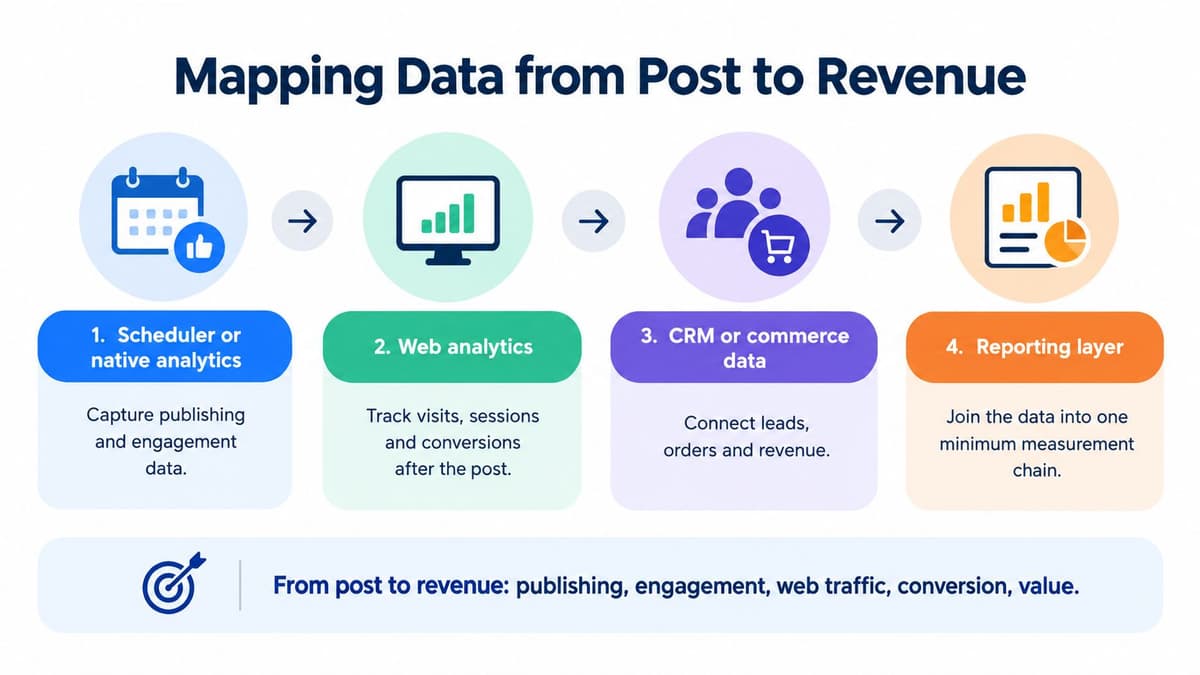
Build the minimum chain before you buy anything else:
- Scheduler or native analytics: Capture post, platform, publish time, reach, engagement and link clicks using consistent campaign naming and UTM values.
- Web analytics: Record social sessions, landing page, qualified visits, assisted conversions and repeat visits for the same campaign labels.
- CRM: Attach source and campaign fields to leads, then track acceptance, pipeline stage and disqualification reasons.
- Commerce or finance: Record orders, revenue, refunds and retention so your outcome reflects value kept, not just value claimed.
- Reporting layer: Join on campaign, date and audience where identity allows, and reconcile totals before anyone presents them.
Label Confidence Instead of Hiding Gaps
Mark each link high, medium or low confidence in the report itself. Confidence is high when UTMs are consistent and the CRM captures them on submission. It drops when consent blocks tracking, attribution windows differ between systems, people switch devices, or the sale happens offline through a rep, a shop or a phone call. Our guide to measuring social media ROI for SaaS teams shows the same chain logic for pipeline reporting, but the principle applies to any team joining post data to revenue.
That fragmentation isn't a personal failure. Qlik's 2025 survey of 250 UK business and IT leaders found only 51% used KPIs directly tied to business performance to evaluate AI initiatives, while 49% lacked internal skills to integrate analytics and business intelligence systems, 37% lacked real-time data integration and 36% reported incompatible tools or platforms. That research concerned AI, not schedulers, but the infrastructure lesson transfers directly. The hard part is joining systems cleanly, not finding a prettier metric.
When the chain is incomplete, use honest fallbacks. Report qualified traffic, assisted conversions, branded search, repeat visits and customer retention, and say plainly that they're directional evidence for social contribution. A slower reconciled extract that matches CRM and finance totals will support a better decision than a live dashboard that refreshes fast and disagrees with every other system in the room.
Testing Incrementality Without a Lab
Platform attribution tells you which posts the platform credited. It doesn't tell you whether those people would have bought, enquired or visited anyway. That's the gap between reporting performance and proving incrementality, and it's where most social reports overclaim.
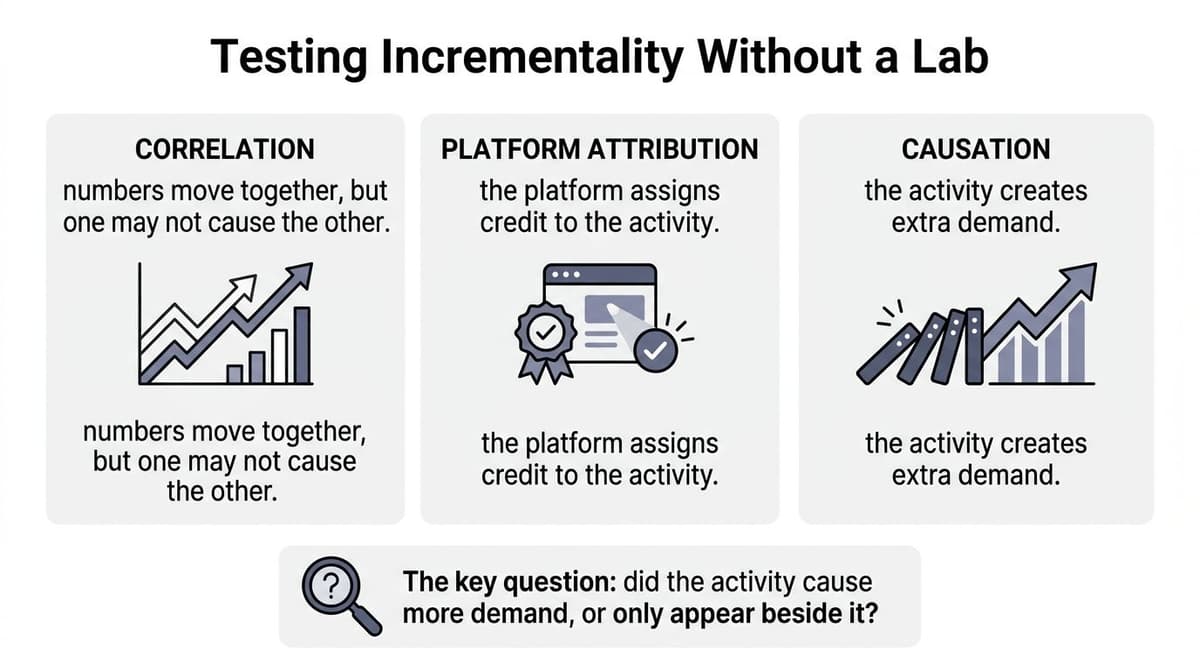
Keep the three ideas separate in your language. Correlation means two numbers moved together. Platform attribution means a system assigned credit using its own window and rules. Causation means the activity created extra demand that wouldn't have happened without it. A campaign with fewer reported conversions can be the better campaign if a simple test shows it produced stronger incremental lift.
You're not alone if you haven't tested this properly. A 2025 Collinson Loyalty Landscape study found only 38% of UK companies track incrementality consistently, while 37% identified data quality as their leading measurement challenge, with limited resources and attribution also significant barriers. That points to small, well-scoped tests rather than a research department you don't have.
Low-Cost Tests a Small Team Can Run
Start with one design you can explain in a sentence:
- Geo split: Run the campaign in comparable regions and hold one back, then compare enquiries, branded search and sales against a dated baseline.
- Channel holdout: Pause one channel for a defined period while keeping others stable, if brand risk allows it.
- Pre and post comparison: Use it only with a stated baseline date and notes on seasonality, pricing or other campaigns that could explain movement.
- Customer survey: Ask new customers what prompted the visit or enquiry, then compare answers with attributed source data rather than replacing it.
The short video below is useful viewing before you scope your first test, especially if your team needs shared language for lift and control groups.
Some activity won't support a clean test. Tiny audiences, always-on brand content and long sales cycles can make lift impractical to isolate. In those cases, present branded search, assisted conversions, repeat visits and structured sales-team feedback as directional evidence, and add a sentence to the report stating what the number does not prove. Honest limits protect your credibility more than a precise-looking attribution total.
Running Cadence Governance and Pitfalls
A measurement system that needs heroics every month will die off. Give it a cadence, named owners and a short list of decisions each meeting is allowed to make. Keep it light enough that a busy social team will still be running it next quarter.
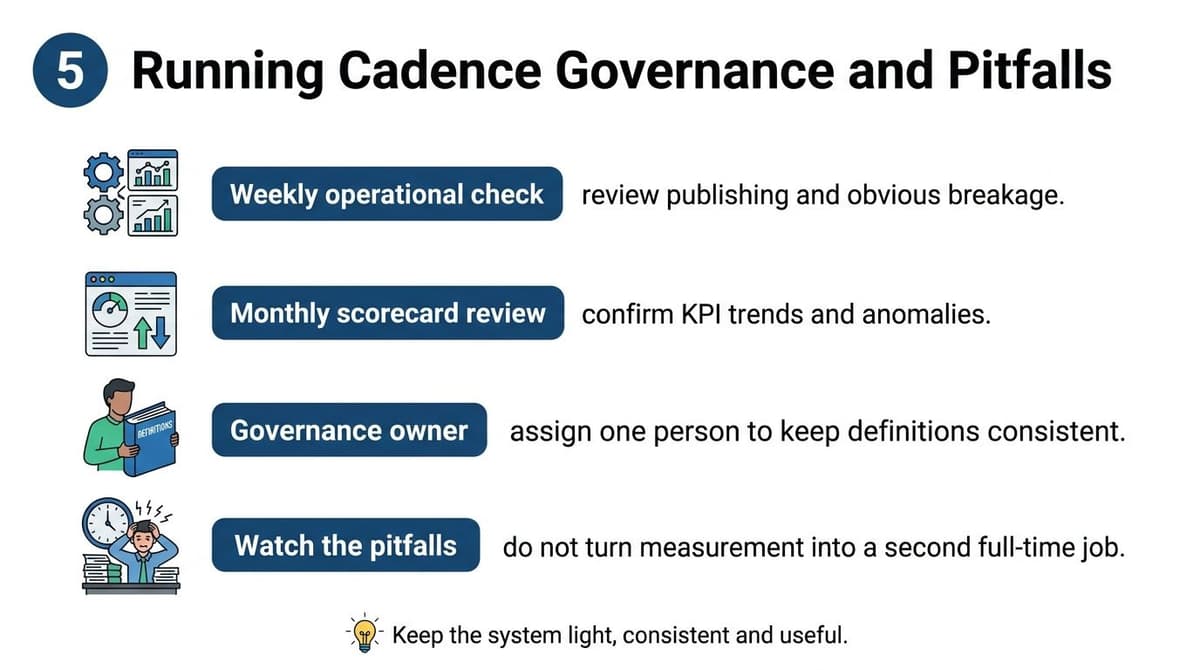
Use three rhythms for three different jobs:
- Weekly operational check: Review publishing output, broken links, missing UTMs and obvious anomalies. Fix production problems, don't rewrite strategy on weekly noise.
- Monthly KPI review: Compare outcome and operational KPIs against the written formulas, confirm sources reconcile, and decide what to scale, stop or test.
- Quarterly baseline reset: Re-examine platform mix, audience segments and targets, because addressable audiences shift even when your posting volume doesn't.
That quarterly reset matters in the UK market. Ofcom reported Meta-owned services accounted for 77% of UK adults' social media news use in 2025, down from 84% in 2022, with Facebook used by 30% of UK adults for news. Date every baseline, keep combined portfolio reporting, and show each platform's separate contribution so a changing mix doesn't hide behind follower counts.
Govern the Portfolio Not the Headline
Assign one owner for the definition, one for the extract, and one person accountable for acting on the result. They can be the same person in a small team, but name the roles anyway so definitions don't drift when someone is away. A periodic social media audit gives you a natural point to retire stale KPIs and repair broken source fields.
Review a small portfolio together rather than worshipping one number. UK public-sector reporting models this well, as the UK Statistics Authority aligned its 2020 to 21 KPI metrics with Radical, Ambitious, Inclusive and Sustainable principles, covering innovation, service use, errors, workforce measures and budgetary control. Your version should balance outcome, quality and resource indicators so a green engagement chart can't hide rising cost, falling lead quality or a team burning out to hit volume.
Paste this line into your reporting doc for every KPI: dated baseline, named denominator, source system, confidence level, owner, and the action if it misses.
Watch the recurring pitfalls. Don't optimise a single headline, treat exposure as conversion, mix reporting periods, compare channels with different denominators, or present a live dashboard figure that contradicts your reconciled file without explaining why. Precision on screen isn't accuracy, and your stakeholders will learn to distrust both if you blur them.
Picking a Scheduler That Supports Measurement
Your scheduler won't fix weak KPI measurement, but the wrong one can make clean reporting harder. Judge tools on whether they help you publish consistently, label campaigns properly, export post-level data, and connect with the analytics and CRM systems already in your chain. Analytics depth, approval workflows and multi-brand handling vary a lot, so match the tool to the measurement job you've defined rather than to a feature checklist.
Scheduler.social is an independent directory and review site, not a scheduling tool. It doesn't publish posts and has no app, dashboard, calendar, pricing plan or sign-up for scheduling. You use it to compare real tools such as Buffer, Hootsuite, Later, Sprout Social, SocialBee, Metricool, Publer, Vista Social, Planable, Postiz and Typefully, using editorial scores, verdicts, pros and cons, pricing information and supported platforms that vendors can't pay to change.
Compare by Team Shape and Reporting Need
Be honest about trade-offs. Some tools suit agencies that need approvals and client separation, some suit solo creators who need speed and a lower-cost start, and some offer deeper analytics that only helps if your team will export and reconcile the data. A cheaper tool with clean campaign labelling can support better KPI measurement than an expensive suite nobody maintains.
Use the directory to narrow the field in the order that matches your decision:
- Start broad: Browse all social media schedulers and filter by platform, budget and team size.
- Go head to head: Use scheduler comparisons when you've got two finalists and need differences laid out plainly.
- Check your main network: Review the best Instagram schedulers or the equivalent page for TikTok, LinkedIn, Facebook, YouTube, Pinterest, Threads or Bluesky.
- Filter by use case: Start from schedulers for analytics if reporting is your priority, or the agency and solo creator pages if workflow matters more.
Check current pricing and features on each vendor's own site before you commit, because plans and integrations change. Then run your shortlisted tool against your written requirements: consistent UTM support, usable exports, post-level performance by platform, and a workflow your team won't abandon. If it can't support the formulas and confidence labels you've agreed, it's the wrong tool however polished the demo looks.
Compare social media schedulers side by side on Scheduler.social, where independent reviews, platform guides and use-case rankings help you judge analytics, workflow and value before you commit. Bring your KPI formulas, data chain and reporting cadence with you, check each finalist against them, and choose the scheduler that supports the measurement your team can defend.