How Is Reach Measured Across Social Platforms in 2026
How Is Reach Measured. Learn how reach is measured on social media in 2026, what separates reach from impressions, and how UK teams can track and report it
You've opened LinkedIn analytics, checked Meta's campaign report and pulled a UK audience summary for your client presentation. Each shows a different reach number, and your client wants one answer: how many people did the campaign reach? Before choosing a figure, you need to check whether those reports are measuring the same thing.
Table of Contents
- The Moment Two Reach Numbers Disagree
- Reach, Frequency and Impressions Explained
- How Major Platforms Report Reach Today
- Why Reach Is Not the Same as Attention or Impact
- Cross-Channel Reach and Why Adding Numbers Usually Fails
- Setting Up Reach Tracking With a Scheduler and Analytics Stack
- Scheduler Analytics, Native Analytics and Independent Measurement
- A Reporting Checklist for Defensible Reach Numbers
The Moment Two Reach Numbers Disagree
Consider a hypothetical marketing manager preparing a campaign review. LinkedIn shows post-level delivery, Meta shows an audience figure for a selected reporting window, and a colleague's industry presentation describes the monthly audience of a social platform.
All look relevant. They aren't interchangeable.
The manager's first instinct might be to trust the largest number, or whichever dashboard looks most authoritative. A better starting point is to read the label beneath each figure and ask what someone had to do to be counted.
Different questions produce different answers
A person visiting a service during a month isn't necessarily someone who encountered your campaign. UK audience reporting distinguishes platform reach from delivery of an individual post: monthly reach describes people visiting a service during that month, while post-level exposure needs separate metrics, as explained in Giraffe Social's guide to interpreting UK social media statistics.
Before copying anything into the presentation, identify:
- The object measured: A post, campaign, account or entire platform.
- The counting unit: People, accounts, viewers or displays.
- The reporting window: The exact period covered, rather than the date you opened the dashboard.
First check: Different reach numbers aren't automatically contradictory. They may be valid answers to different questions.
For campaign reporting, choose the figure that matches the campaign's scope, then preserve its original definition. Don't replace a missing campaign metric with a platform's overall audience size because both reports use the word reach.
Reach, Frequency and Impressions Explained
So, how is reach measured in principle? Start with a defined audience and time period, identify who was exposed, and count each person once within that scope.
JICMAIL's audience definitions describe reach as the number of people exposed to a particular type of mail, reported as an audience count or percentage. Its distinction between reach and frequency provides a useful foundation for interpreting social media: reach counts unique people; frequency describes average repeat exposure.
Think of a venue's guest list
Reach is like counting the different guests who entered a venue. Impressions are like recording every entrance, including return visits. Frequency describes the average number of entrances per guest.
The analogy has a limit: a social platform's identifier might represent an account rather than a verified individual. Your report should keep that distinction visible instead of changing “accounts reached” into “people reached”.
Reach vs frequency vs impressions
| Metric | What it counts | Units | When to use it |
|---|---|---|---|
| Reach | Unique people or accounts within a defined scope | Audience count or percentage | Assessing distribution breadth |
| Frequency | Average exposures per reached person or account | Exposures per audience member | Assessing repetition |
| Impressions | Total recorded displays, including repeats | Display count | Assessing delivery volume |
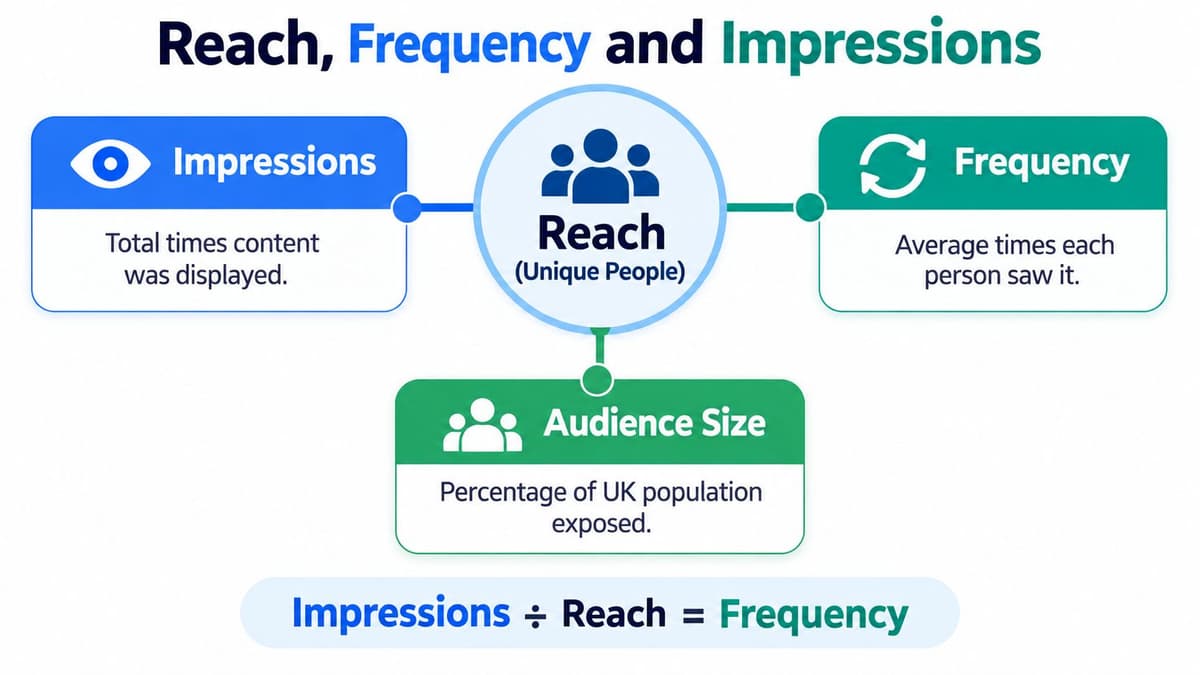
For compatible data, impressions ÷ reach = average frequency. Both inputs must cover the same content, population and period. Dividing campaign impressions by an account's unrelated monthly audience won't produce a meaningful frequency.
A large impression total doesn't necessarily mean broad distribution. It may reflect repeated delivery to the same audience. Equally, broad reach with little repetition describes a different exposure pattern, not automatically a better campaign.
Keep all these measures together, but don't treat them as substitutes.
How Major Platforms Report Reach Today
For a current report, preserve each platform's native metric name. Don't assume that a column called “reach” in an analytics export has the same definition across every connected account.
What to inspect on each platform
Use the following as a reading guide, then confirm the live metric description and available reporting scope before exporting.
| Platform | Audience metric to inspect | Reporting check |
|---|---|---|
| Facebook and Instagram | Reach or accounts reached in native insights and campaign reporting | Meta's reach is a deduplicated estimate for the selected window. Keep account, post and campaign scopes separate. |
| TikTok | Unique viewers in video analytics | Distinguish the video's unique audience from its total views. |
| Unique members reached in post or advertising analytics, where available | Keep organic and advertising reports separate and retain the member-based label. | |
| YouTube | Unique viewers in YouTube Analytics | Treat this as a viewer estimate, not a count of registered accounts. |
| X and Threads | The exact audience or display metric available in native analytics | Don't rename views or impressions as unique reach. |
| Available audience and impression measures in native analytics | Confirm whether the audience figure applies to a Pin or a wider account period. | |
| Bluesky | The metrics available through the reporting method you use | If there's no documented unique-audience measure, mark reach as unavailable. |
For LinkedIn specifically, the distinction between delivery and audience size matters. Keep what a LinkedIn impression means alongside your metric dictionary so colleagues don't confuse repeated displays with members reached.
Preserve the definition before standardising
Audience demographics, when available, can help assess relevance. They don't change whether the underlying metric counts unique viewers, accounts or displays. Record any demographic filters applied to the export.
A broader planning resource is Sprints & Sneakers' data-driven growth framework. Use it as a companion to defining campaign objectives, not as evidence that unlike platform metrics can be combined.
The number to copy is the native unique-audience metric that matches your reporting scope. If none is available, report the metric you do have under its proper name.
Why Reach Is Not the Same as Attention or Impact
Someone can qualify for a reach count without absorbing your message. Distribution is necessary for communication, but it isn't proof of attention, understanding or persuasion.
Ofcom's UK news consumption research explicitly distinguishes reach from share of attention, which weights the focus services receive among their users. It reported that Facebook reached 30% of UK adults for news in 2025, compared with 11% for TikTok, but those reach figures alone don't establish how much attention either audience gave a branded message.
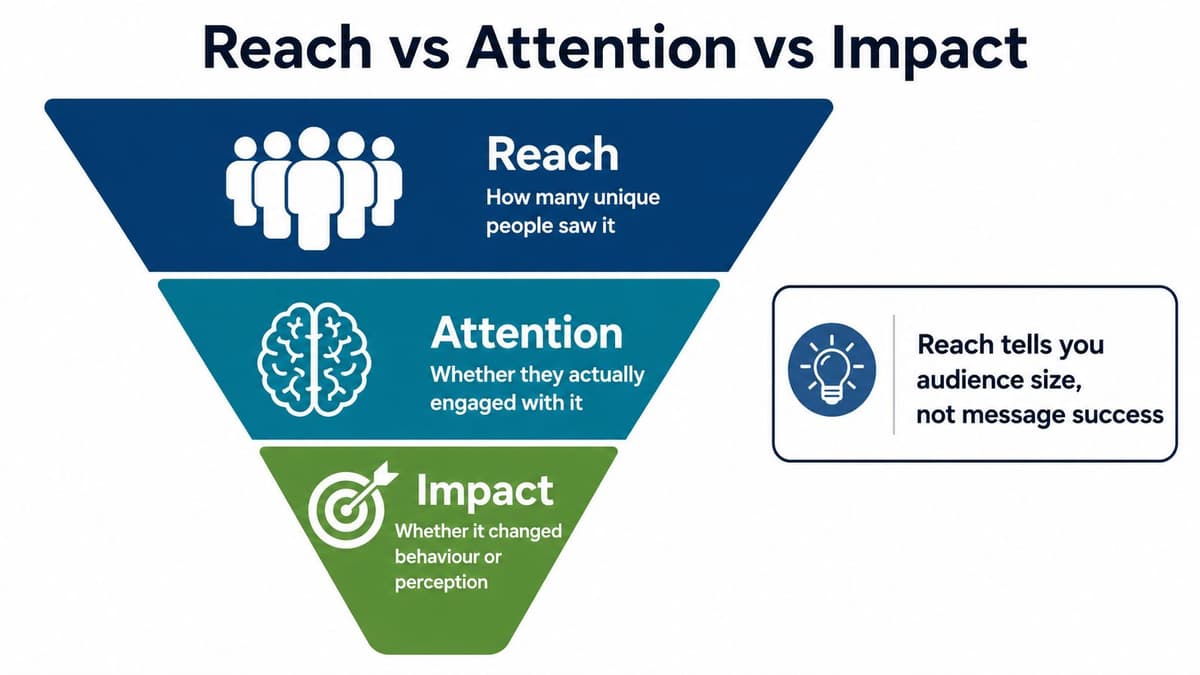
Follow exposure towards an outcome
A useful reporting sequence is:
- Unique audience reached: Who qualified for inclusion under the source's exposure definition?
- Frequency: How much repeat delivery occurred?
- Attentive exposure: What evidence suggests people gave the content time or focus?
- Engagement: What interactions followed?
- Downstream action: Did people take the action the campaign intended?
Consider a hypothetical campaign with 500,000 reach. That figure describes its audience breadth, not a measured result for a real brand. If Facebook and TikTok supplied different watch-time or interaction patterns, you'd need those additional measures before judging which channel delivered more valuable exposure.
A person counted as reached isn't automatically a person who noticed, remembered or acted.
Don't equate engagement with attention either. Someone may read carefully without clicking, while a quick interaction may reveal little about comprehension. Choose supporting measures that fit the format and objective, and keep their limitations visible.
When calculating interaction rates, specify the denominator using a consistent engagement-rate calculation. A rate based on followers answers a different question from one based on reached accounts.
Finally, keep platform-reported exposure separate from representative population research. Logged-in accounts or estimated users aren't automatically equivalent to independently measured people.
Cross-Channel Reach and Why Adding Numbers Usually Fails
Adding Facebook reach to Instagram reach and LinkedIn reach doesn't establish a unique campaign audience. You need to know how many people appear in more than one dataset.
Think of a hypothetical UK campaign targeting people aged 25–44. The same person might encounter it on all those services. Each channel can legitimately include that person in its own count, but the combined campaign audience should include them only once.
The missing ingredient is overlap
Deduplicated cross-channel reach requires a method for identifying or estimating that overlap. A shared campaign name, matching dates or identical creative doesn't provide it.
UK audience measurement also combines different data sources and definitions. Ipsos iris's measurement documentation describes a hybrid approach using metered behaviour from a core panel of 10,000 single-source participants alongside census site-centric measurement. That methodological context matters when interpreting Ofcom-based reporting among UK online adults rather than all residents, and it doesn't make separate platform dashboard figures additive.
Independent audience measurement can inform market-level overlap. Don't assume it deduplicates exposure to your particular campaign.
Before presenting a combined figure, ask:
- Identity method: How were audience members matched or modelled across channels?
- Compatible scope: Did every input measure the same campaign period and target population?
- Uncertainty: Does the provider publish confidence limits or other qualifications for the estimate?
For a supplementary resource on the reporting problem, Netco Design LLC's how to stop double counting is relevant to checking aggregation habits. Your campaign still needs its own documented method.
Report uncertainty honestly
If a provider supplies confidence limits, retain them and explain what they cover. If none are published, say that uncertainty isn't quantified; don't invent an interval.
Without deduplication, present channel reach separately. If someone insists on a sum, label it as a non-deduplicated sum of channel reach, not unique people reached. Keep country, denominator, date range and measurement system beside the figures so readers can assess their compatibility.
Setting Up Reach Tracking With a Scheduler and Analytics Stack
Build a reporting workflow before collecting screenshots. The aim is a repeatable record that lets another analyst reproduce your campaign summary and understand every metric.
Choose software against your reporting needs
Compare real scheduling tools such as Buffer, Hootsuite, Later, Sprout Social, SocialBee, Metricool, Publer, Vista Social, Planable, Postiz and Typefully. Don't assume every tool provides the same analytics for every supported network.
Scheduler.social is an independent directory that reviews and compares scheduling tools, not software that schedules or publishes posts. Use its scheduler directory, head-to-head comparisons, and platform guides for Instagram or LinkedIn to build a shortlist.
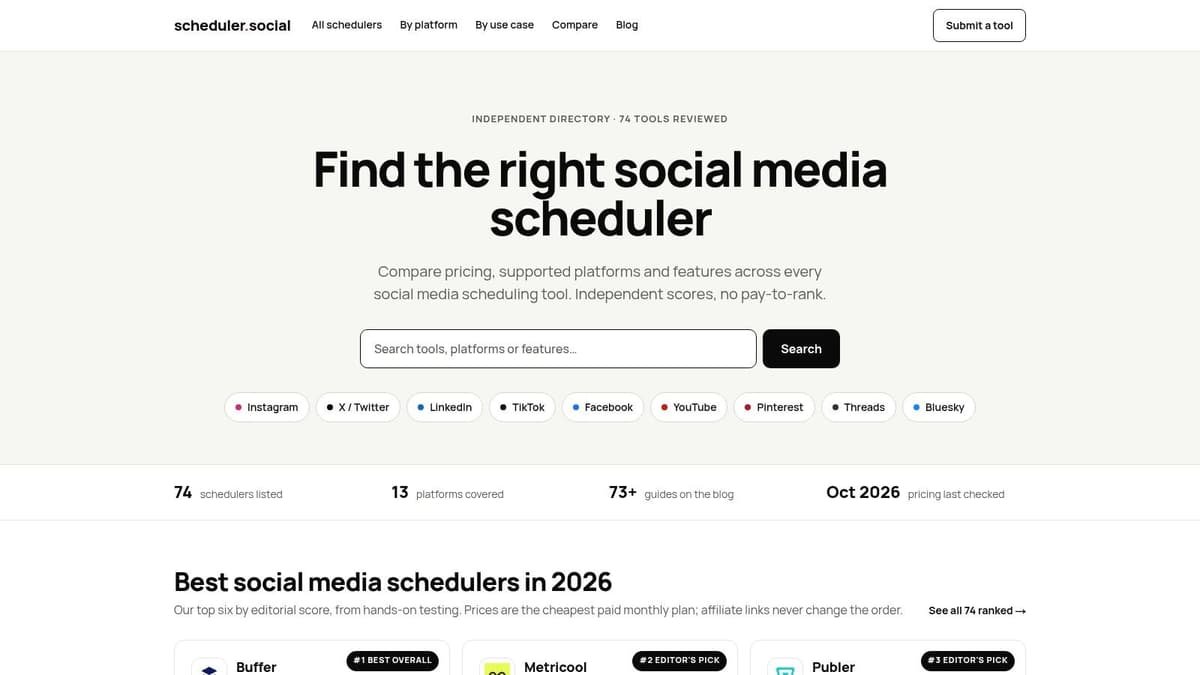
Verify reach availability, export access, reporting history and account permissions on each tool's current site. Treat pricing as changeable, and assess limitations alongside strengths.
Create a repeatable collection routine
Connect the relevant accounts to your chosen scheduler where supported, then compare its exported metric definitions with native analytics. Select a fixed weekly or monthly collection cadence and a consistent reporting timezone.
Use a spreadsheet or BI tool with fields such as:
| Field group | What to record |
|---|---|
| Identity | Client, campaign name, platform, account and post identifier |
| Scope | Country, audience denominator, start date, end date and timezone |
| Metric | Original label, value, unit, content scope and paid or organic status |
| Provenance | Native source, exporting tool, extraction date and definition notes |
| Quality | Missing values, uncertainty notes and deduplication status |
Use campaign naming conventions that colleagues can follow without interpretation. Separate platform, creative and campaign identifiers rather than burying them in an inconsistent free-text label.
Add consistent UTM tags to destination links for website-outcome reporting. Keep those outcomes alongside reach, but don't treat UTM-tagged visits as proof of cross-platform audience identity.
Save raw exports before transforming them. Record any filters or manual corrections, and distinguish unavailable data from genuine zero values. That gives your next campaign review an audit trail instead of a folder of unexplained screenshots.
Scheduler Analytics, Native Analytics and Independent Measurement
The source to trust depends on the question. A convenient reporting interface isn't necessarily the right authority for every measurement task.
Choose the source by its role
| Source | Appropriate role | What to verify |
|---|---|---|
| Scheduler analytics | Coordinating routine reporting across managed accounts | Available metrics, refresh timing, export transformations and missing data |
| Native analytics | Checking the platform's own post or campaign delivery | Definitions, filters, date settings and paid or organic scope |
| Independent UK measurement | Understanding the wider audience and planning context | Population, methodology, measurement period and relevance to your question |
When a scheduler report and native analytics disagree, compare like-for-like exports before deciding that either is wrong. Check the extraction time, reporting window and content selection, then establish whether the scheduler reproduces the native metric or applies a different aggregation.
Don't assume a convenient cross-channel total is deduplicated. Ask for the calculation.
Market context isn't campaign delivery
JICMAIL's methodology places its measurement role alongside established UK currencies: BARB for television, RAJAR for radio and PAMCo for publisher readership. Its diary-based approach offers a useful reminder that audience estimates come from defined measurement systems, not just dashboard counters.
For digital market context, reporting on Ofcom's May 2025 figures gives monthly reach among UK online adults as 94% for YouTube, 93% for Facebook and Messenger, 90% for WhatsApp, 78% for Instagram and 56% for TikTok. Those are dated service-audience observations, not current campaign delivery guarantees.
Decision rule: Use native reporting to resolve platform-delivery questions, scheduler reporting to organise the workflow, and independent measurement to assess the market around it.
For tool selection, compare agency reporting needs and analytics-focused options. Evaluate a candidate's reporting limitations against the work your team performs, rather than choosing from a feature list alone.
A Reporting Checklist for Defensible Reach Numbers
A defensible report lets a client understand what was counted without opening the original dashboard. Attach the definition to the figure, not to an appendix that nobody will read.
Check the figure before presenting it
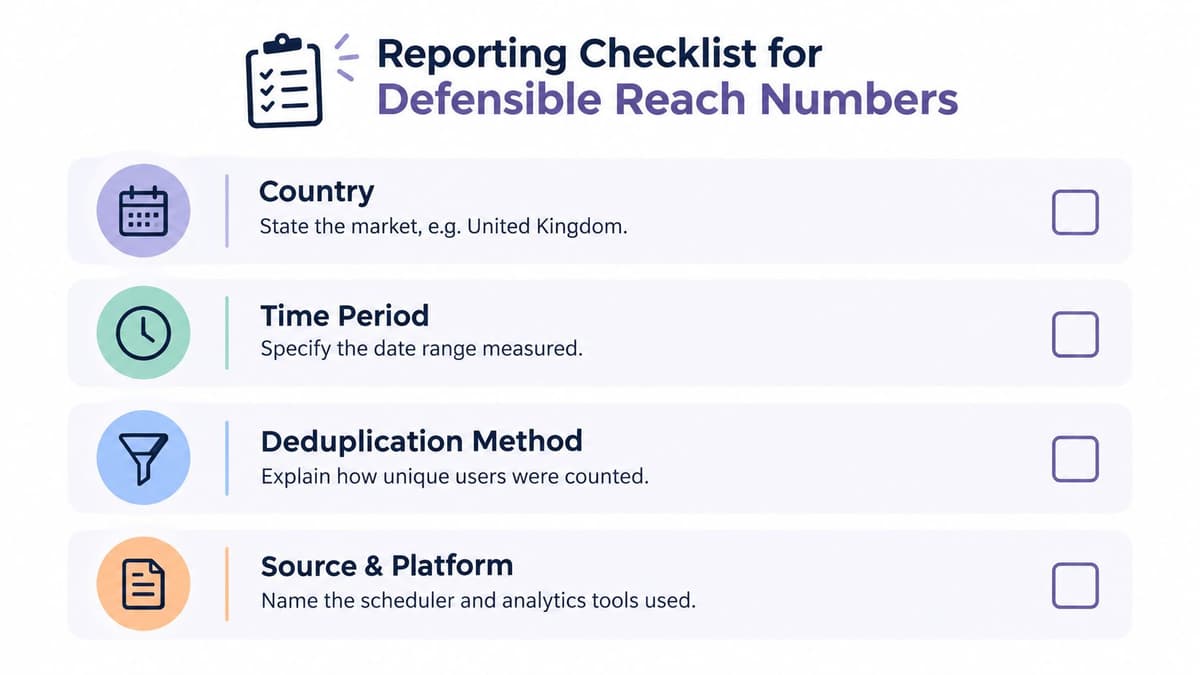
- Country: State the measured market, rather than assuming an account's location defines its audience.
- Denominator: Identify people, accounts, viewers or the relevant population behind a percentage.
- Date range: Include the measurement window and reporting timezone.
- Metric type: Preserve whether the number describes platform use, campaign reach, post reach or impressions.
- Provenance: Name the source and record when you extracted the data.
- Quality notes: Include published uncertainty, missing coverage and any relevant limitations.
Before summing channels, confirm audience matching, compatible scope and documented uncertainty. If those checks fail, keep the figures separate.
Watch for a total without a deduplication method, impressions relabelled as reach, and blank cells converted to zero. These can make a report appear more complete while making its conclusions less reliable.
Use a social media audit to review those reporting conventions. For evaluating outcomes beyond distribution, Rebus's guide to how to measure campaign success provides a complementary planning resource.
Match your next tool to the reporting gap
Platform-specific comparisons cover TikTok, X, Facebook, YouTube, Pinterest, Threads and Bluesky.
You can also compare options for solo creators, free plans, approval workflows, AI writing, open-source software and enterprise teams.
Choose around the reporting problem you need to solve. More charts won't fix an undefined metric.
Scheduler.social offers independent reviews and comparisons of social media scheduling tools, helping you assess options without mistaking the directory for a scheduler itself. Visit to compare tools against your platforms, export requirements and analytics needs, then find the right scheduler for a more defensible reporting workflow.